The consolidated balance sheet of urban co-operative banks expanded moderately in 2018-19 on the back of robust deposit growth which financed the pick-up in lending, according to RBI’s report on ‘Trend and Progress of Banking in India’, released in December end.

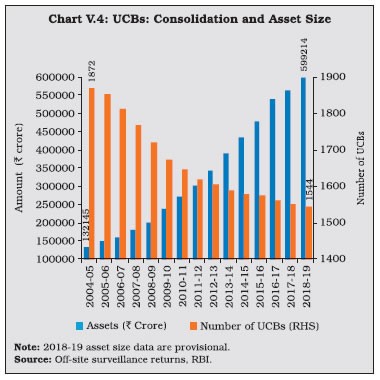
At the end of March 2019, credit co-operatives comprised 1544 urban co-operative banks (UCBs) and 96,248 rural co-operative banks (end-March 2018, with the latter accounting for 64.7%of the total assets of co-operatives. The growth of these co-operative institutions has not been commensurate with that of other constituents of the banking sector in India. At the end of March 2018, the combined assets of urban and rural co-operatives were 10.6% of the total assets of scheduled commercial banks (SCBs), down from 19.4% in 2004-05. Several operational and governance-based impediments have operated as drags on their performance, stunting their growth.
Despite their large number, UCBs account for 3.6% of the total assets of SCBs. Most of them are single branch entities, with limited avenues to raise capital.
Maharashtra, which has the largest number of UCBs across states, has accounted for the highest number of mergers. Notwithstanding the fall in the number of UCBs, however, their combined asset size has continuously increased.
UCBs are classified for regulatory purposes into tier 1 and tier 2 categories, based on their depositor base. Tier 2 UCBs have larger depositor bases and wider geographical presence than their tier 1 counterparts. During 2018-19, the number of tier 2 UCBs increased sharply.
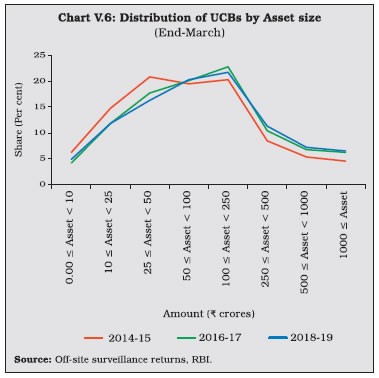
The combined balance sheet of UCBs witnessed robust expansion underscoring the effectiveness of measures taken to strengthen their financials. However, in the recent years, UCBs’ assets growth has moderated. In 2014-15, the distribution of UCBs became bi-modal, with concentration in two asset brackets viz., Rs250 million to Rs500 mn and Rs1 billion to Rs2.5 bn. Since 2016-17, however, the distribution has become uni-modal, with the largest frequency concentrated at the Rs1 bn to Rs2.5 bn asset bracket. Moreover, there has been a rightward shift in the distribution, with the share of UCBs with assets greater than Rs10 bn increasing to 6.5% in 2018-19 from 4.6% in 2014-15.
 Deposits, which accounted for 89.5% of the resource base of UCBs, revived during 2018-19 after a deceleration in the previous year. Nonetheless, UCBs’ deposit growth remains well-below the average of 13.9%achieved during 2007-08 to 2016-17.
As deposit growth moderated during 2017-18, lending had to be financed by a steep increase in borrowings. This growth in borrowings reversed during 2018-19 as pick-up in deposit growth financed the increase in loans and advances.
While UCBs with deposit bases upto Rs100 mn formed the modal class at the end of March 2008, the Rs1 bn to Rs2.5 bn bracket became the modal class at the end of March 2019. This suggests an increase in average deposit per account as well as an expansion of the customer base of UCBs. In contrast, UCBs with advances in the range of Rs 100 mn to Rs 250 mn formed the modal class during 2018-19. During 2016-17 and 2017-18, the incremental credit-to-deposit ratio of UCBs rose above those of SCBs, owing to the impact of high deposit growth on account of demonetization in 2016-17 and lower credit growth of SCBs in the next year. This upturn was, however, reversed in 2018-19 with a pick-up in credit growth of SCBs.